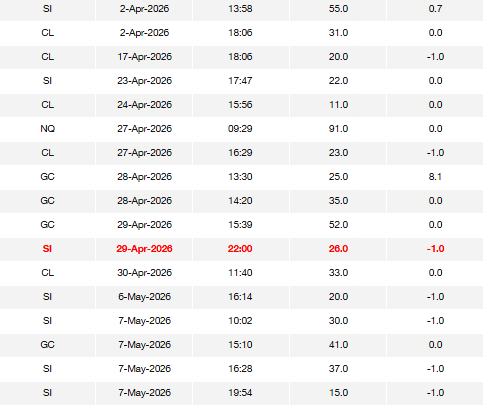
29 April 2026. I spent the whole afternoon trying to catch longs on gold and silver. By this point I already had two losses and a breakeven.
I took another entry. It aligned with my plan. Stopped out. Then price ripped. Right in front of me.
How many of you would FOMO back into that trade?
I could have. I didn’t. Why? Because my trading plan and my data have already shown me what my equity curve looks like over the long run.
Yes, it can feel unfair
“I’ve spent close to 8 hours stalking this chart. I’m right about the direction. I even caught the trade. So why did the market take my stop loss by one point and then go in my favour?”
Stop thinking the market is out to get you. The purpose of opening a trade is to close it. You end up with one of three things: a profit, a breakeven, or -1R.
You look at hundreds, not the last ten
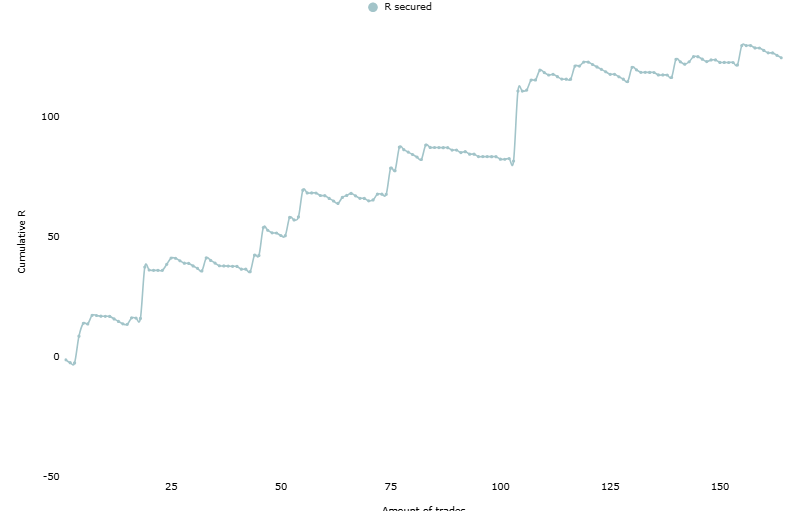
You don’t base your thinking off the past 10 trades. You look at a set of hundreds. Yes, it might suck to see your equity curve down. But something is guaranteed in trading: drawdowns. That is exactly why risk management is so important.
Zoom out
Here is the result of my past 17 trades. It’s kind of breakeven-ish. But if you look at the long term, that is where the magic happens. You see the general, upward-sloping curve. The drawdown you are panicking about is just one flat stretch on it.
Two losses, a breakeven, a stop tagged by a point. Logged. I waited for the next setup and got on with my day. That is the job.